How To Create Reports And Dashboards In Salesforce
One of the features that makes Salesforce one of the most powerful Customer Relationship Management (CRM) platforms is its robust reporting and data visualization. Reports and dashboards in Salesforce help businesses get the most out of their customer and sales data: You can gain granular insights into things like the best/worst performing sales territories, the most profitable customer segments, and the real-time value of your sales pipeline.
The catch: Many users—especially newbies—are easily overwhelmed by Salesforce's reporting capabilities, and therefore fail to use them at all. Here, we'll demystify these features and walk you through how to create reports and dashboards in Salesforce.
What Is a Salesforce Report?
A report in Salesforce is really just list of data within the system, based on user-specified criteria. For example, you might want to see all leads currently open in the state of Texas—that list is a report. You can create reports from any standard Salesforce objects, including leads, accounts, contacts, and opportunities.
Reports are great for analyzing customer and sales data, but they're also helpful for internal sales operations. A sales manager might want to create a report showing things like the number of phones calls their team is making per week, the sales pipeline for each salesperson, or the number of lost deals over the last quarter.
Salesforce comes with more than 50 pre-defined report templates that businesses can easily get up and running with. Once you learn the ins and outs of how to create, filter, and customize reports, you can then alter these templates to your liking or create entirely new ones from scratch.
How to Create a Report in Salesforce
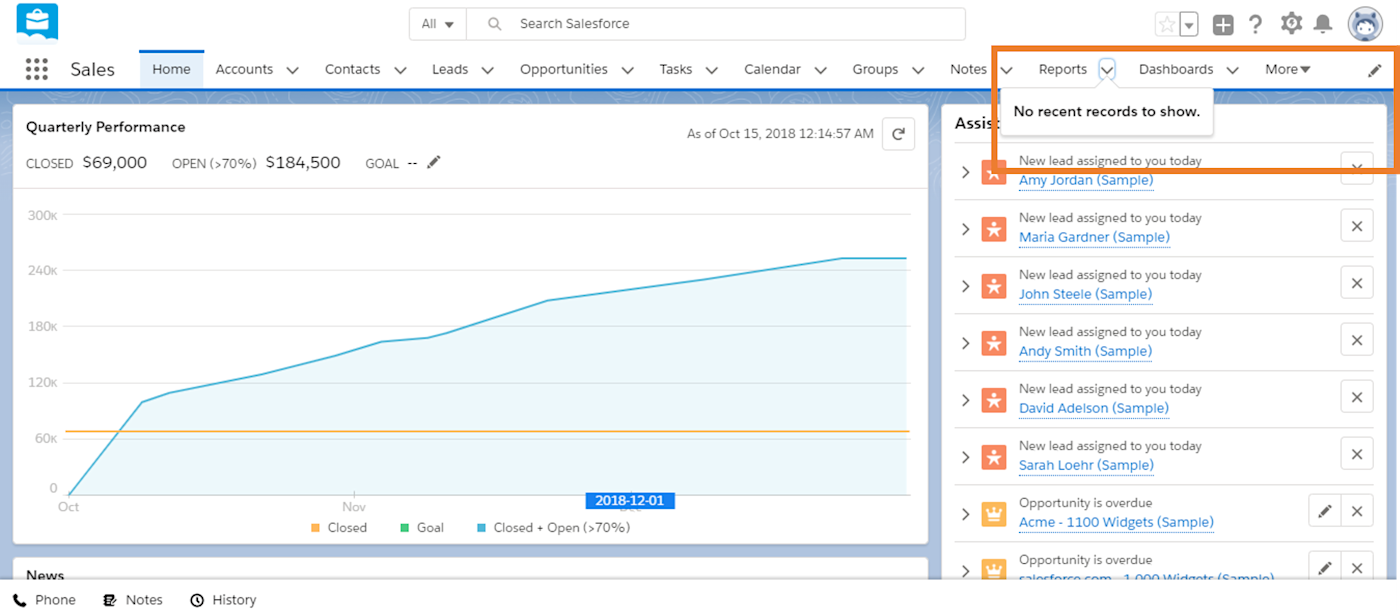
To start, click on the Reports tab in the top right of the menu bar. If you don't see it, it may be buried under the More tab. And if it's still not there, click the pencil icon to add it to the menu bar.
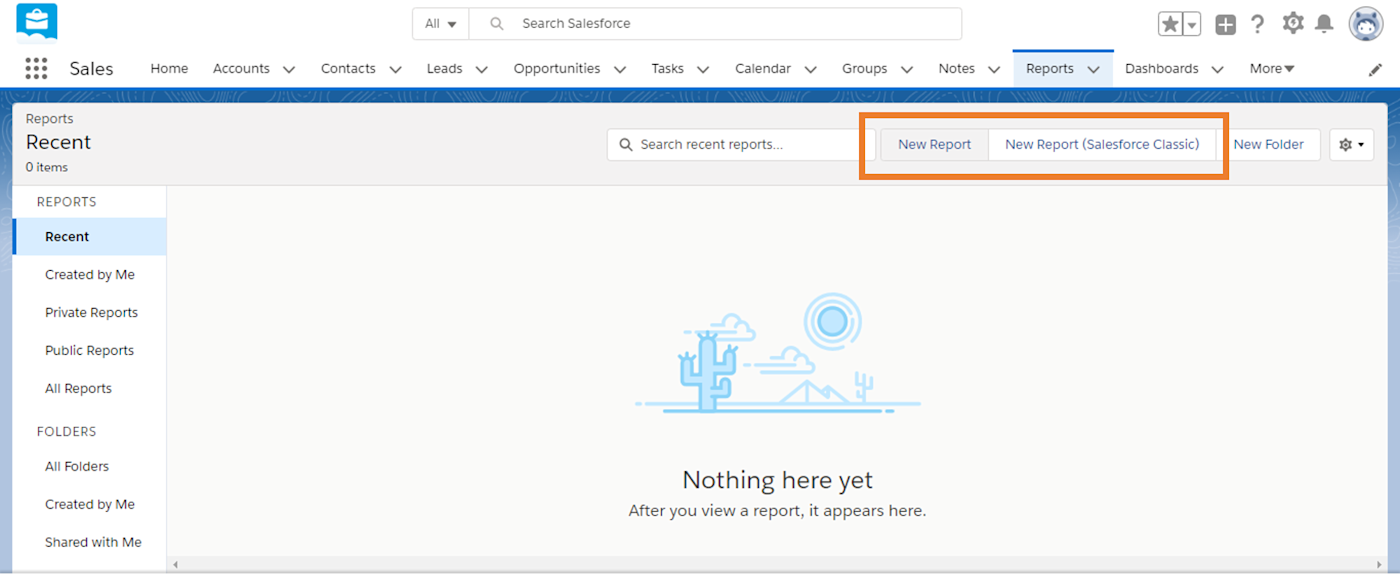
Once you click into the Reports tab, you'll be taken to the main screen for reports. Here, you can either run, edit, or view existing reports—or create a new one. To create a new report, select New Report in the top-right.
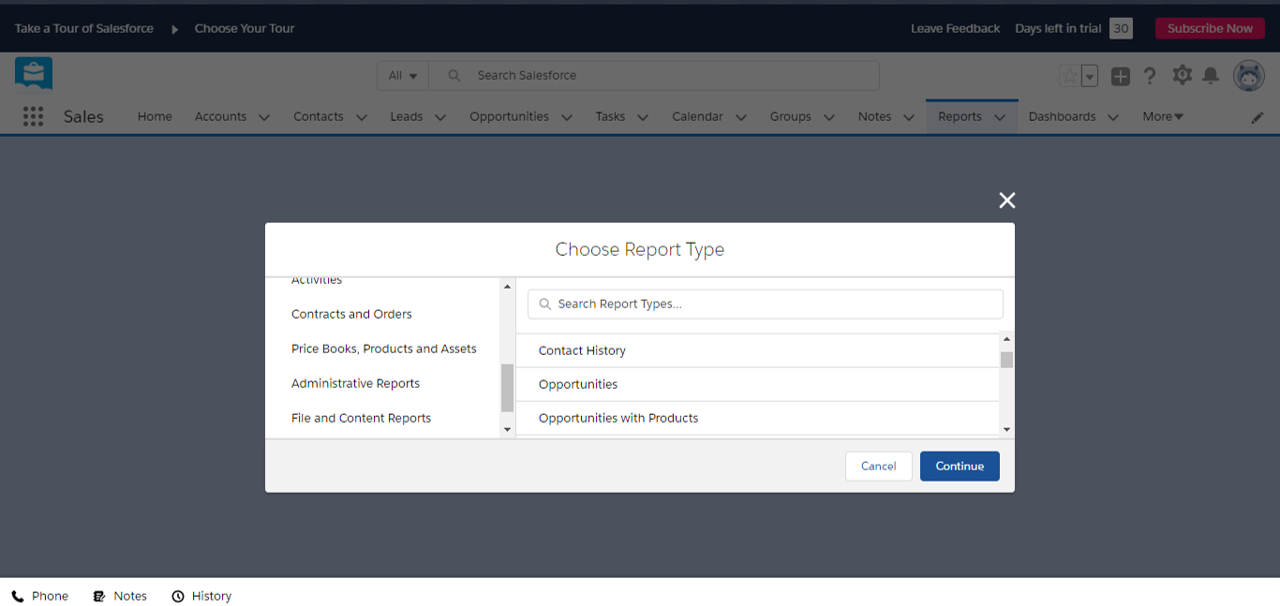
You'll see an overlay that will let you choose the type of report you want to create. The most common reports are those based on objects like contacts, accounts, leads, and opportunities. To browse the other types of pre-built templates, either scroll down or use the search bar.
Once you've selected a report type (we've chosen Opportunities for this example), you'll be taken to the next screen, where you can customize and/or filter the data in the report type. Click the Filters tab on the left sidebar to view the criteria already in place via the template settings. In the image below, the filters are set to show us all sales opportunities in the current fiscal quarter for the entire company.
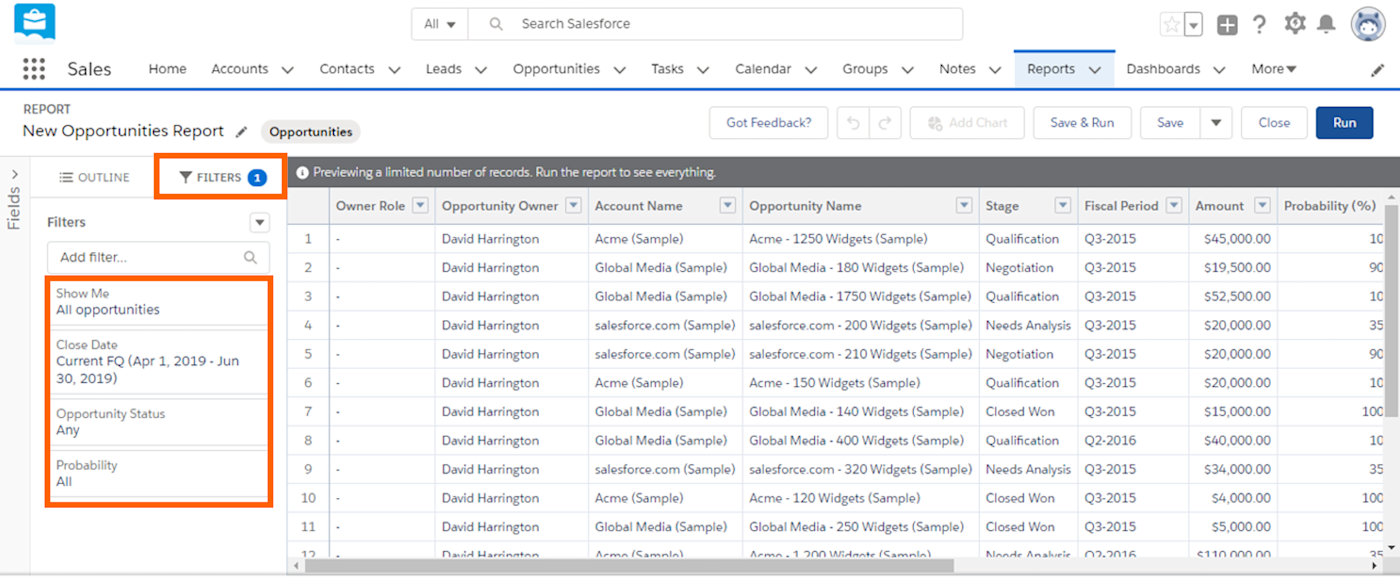
If you want additional filtering criteria beyond what's there, search in the Add Filter box. In this case, let's see only the opportunities that were won for the quarter.
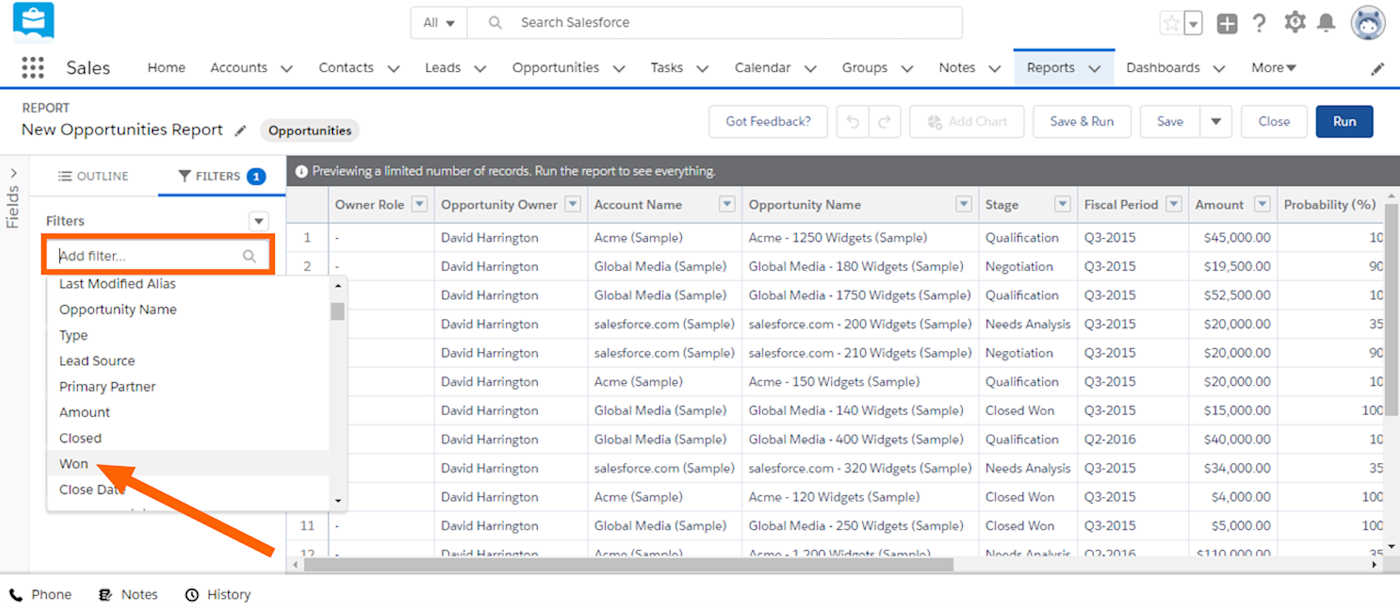
Once you've entered the filter, the list will automatically update to show only the won deals for the quarter.
Before you run the report, you may also want to check the Outline tab. This allows you to customize which data associated with the opportunities you want to show. For example, you may not want to see the Probability %. Click the x to get rid of any data you don't need in your report.
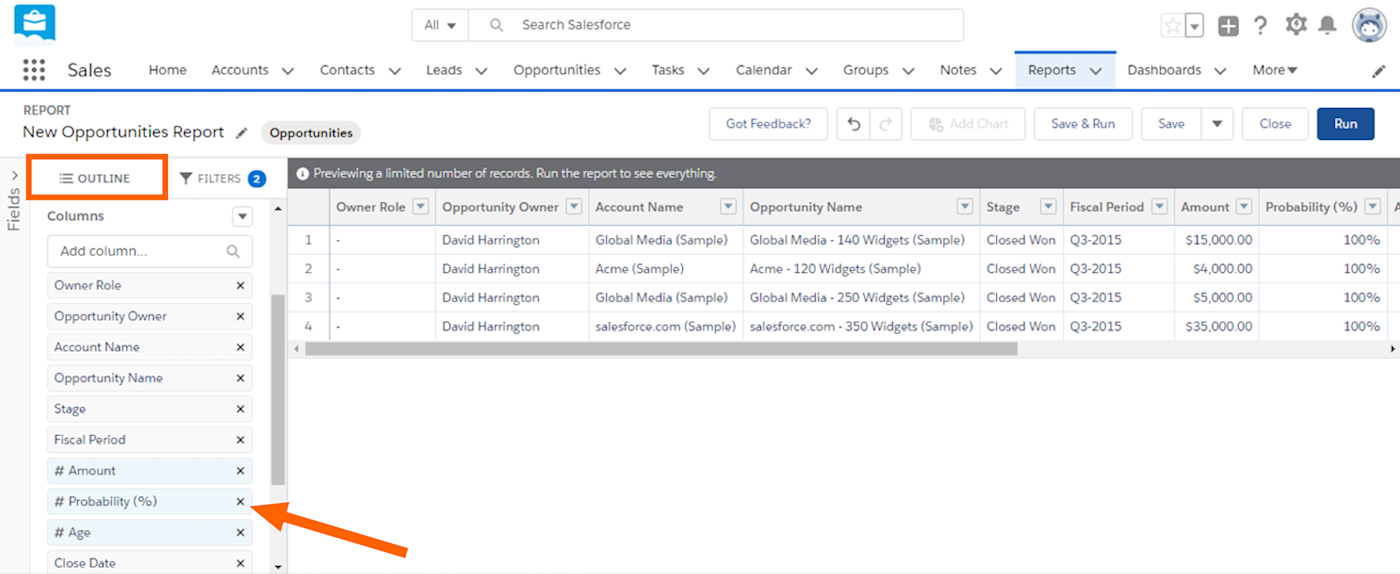
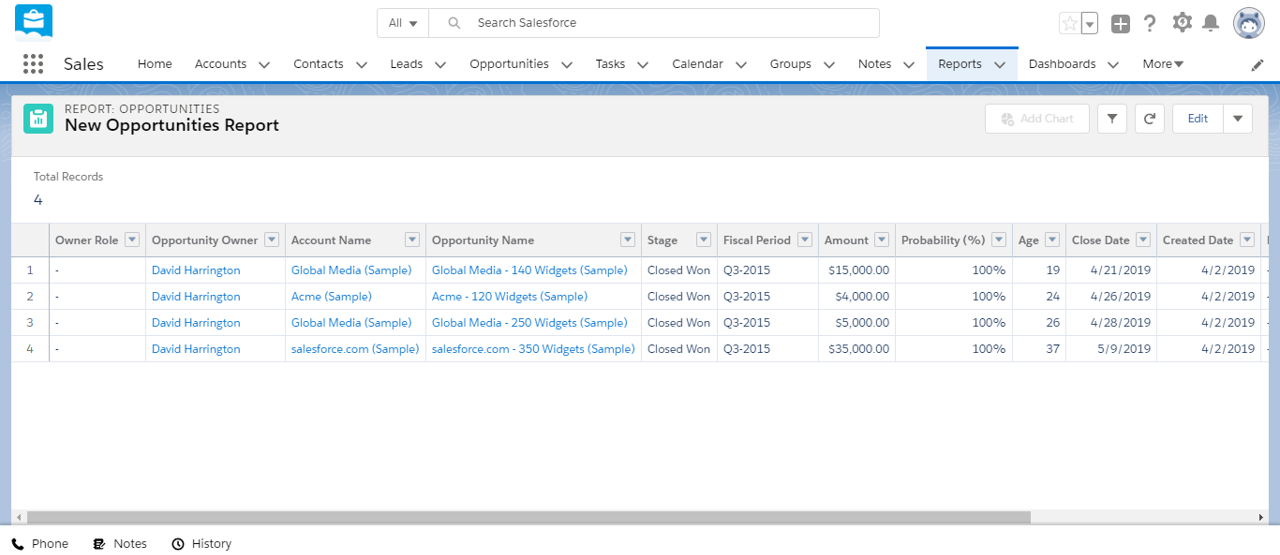
Once your filters and outline are in place, click the Run button in the top right to create the report. (Keep in mind that you haven't actually generated the report until you've clicked Run.) You'll then see the final list, which you're ready to turn into a dashboard item.
What are Salesforce Dashboards?
Dashboards in Salesforce are a real-time visualization of Salesforce reports. You can create a dashboard item based on standard reports already in Salesforce (meaning you don't even have to create a report first) or based on customized reports that you create. Here's an example of what a Salesforce dashboard looks like.
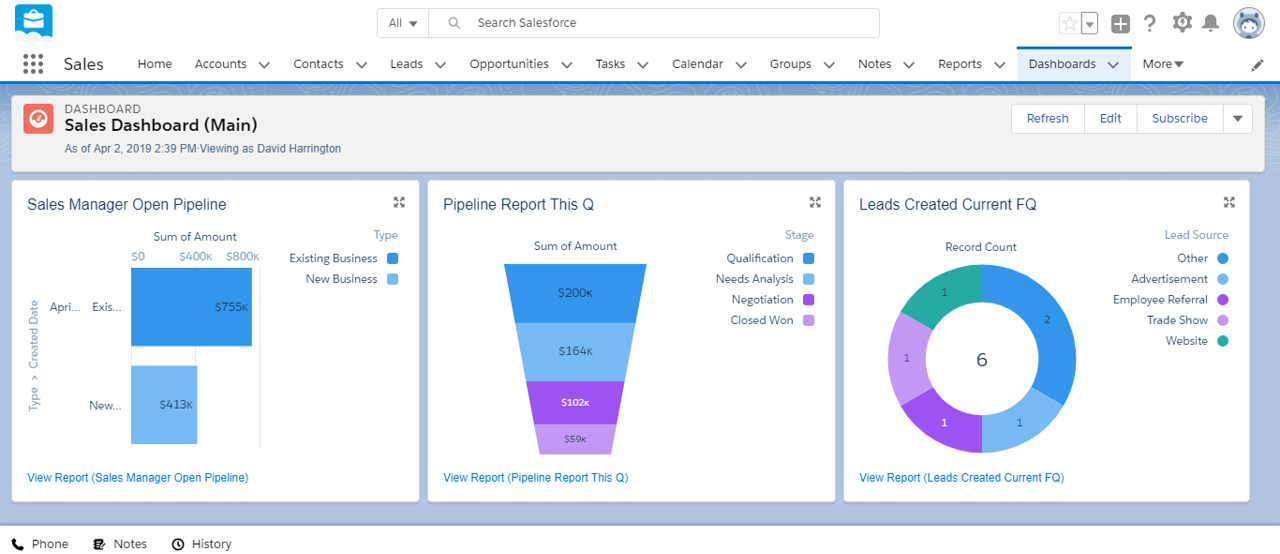
Salesforce dashboards give you a real-time snapshot of your relevant metrics. It's a great way for a sales manager to get a big picture of their sales team, for a salesperson to gauge their pipeline, or for a marketer to analyze lead sources.
How to Create a Dashboard in Salesforce
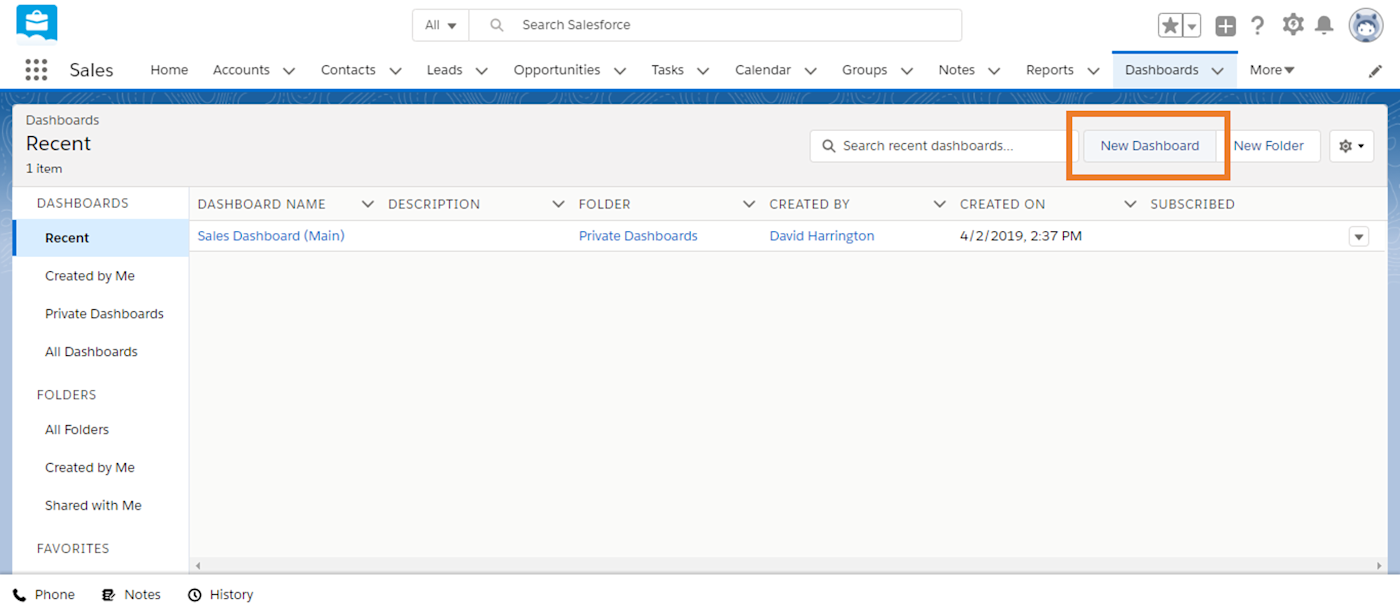
To create a dashboard, click Dashboards in the top menu. From there, you can either edit the components of an existing dashboard or create a new one. To create a new dashboard, select the New Dashboard option toward the top right.
You'll then be taken to the New Dashboard creation overlay. Choose a dashboard name that reflects your role and use case, like "Main Sales" or "Marketing," for example. Once you've typed a name, click Create.
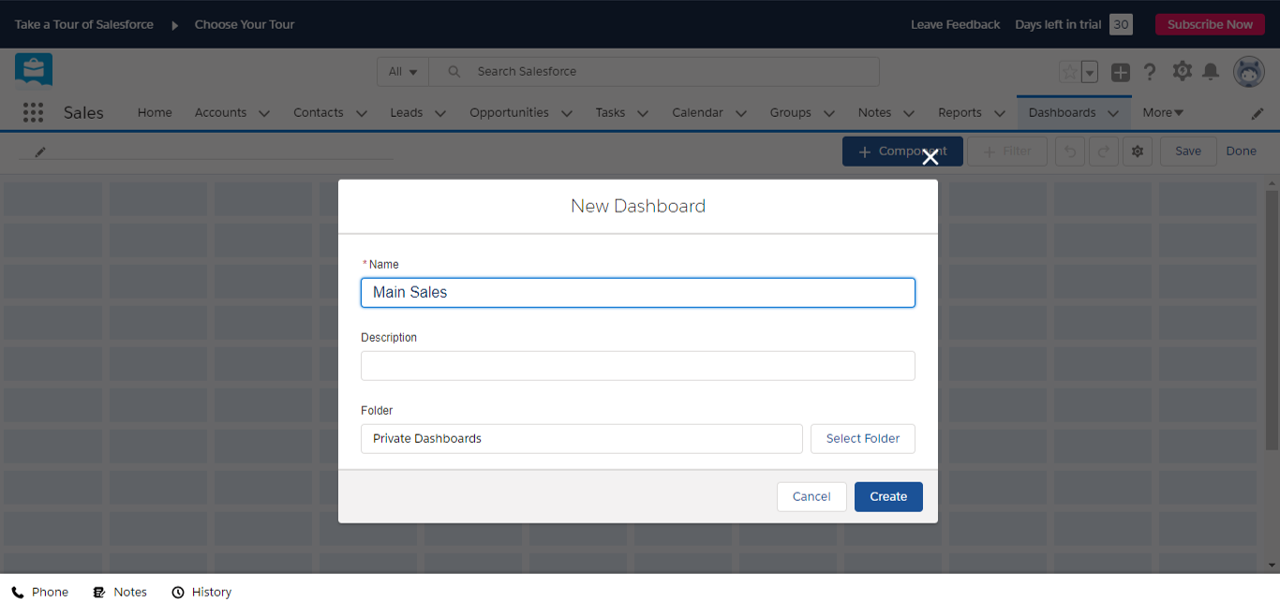
You'll be taken to a blank canvas where you'll be able to add, edit, and customize specific dashboard elements.
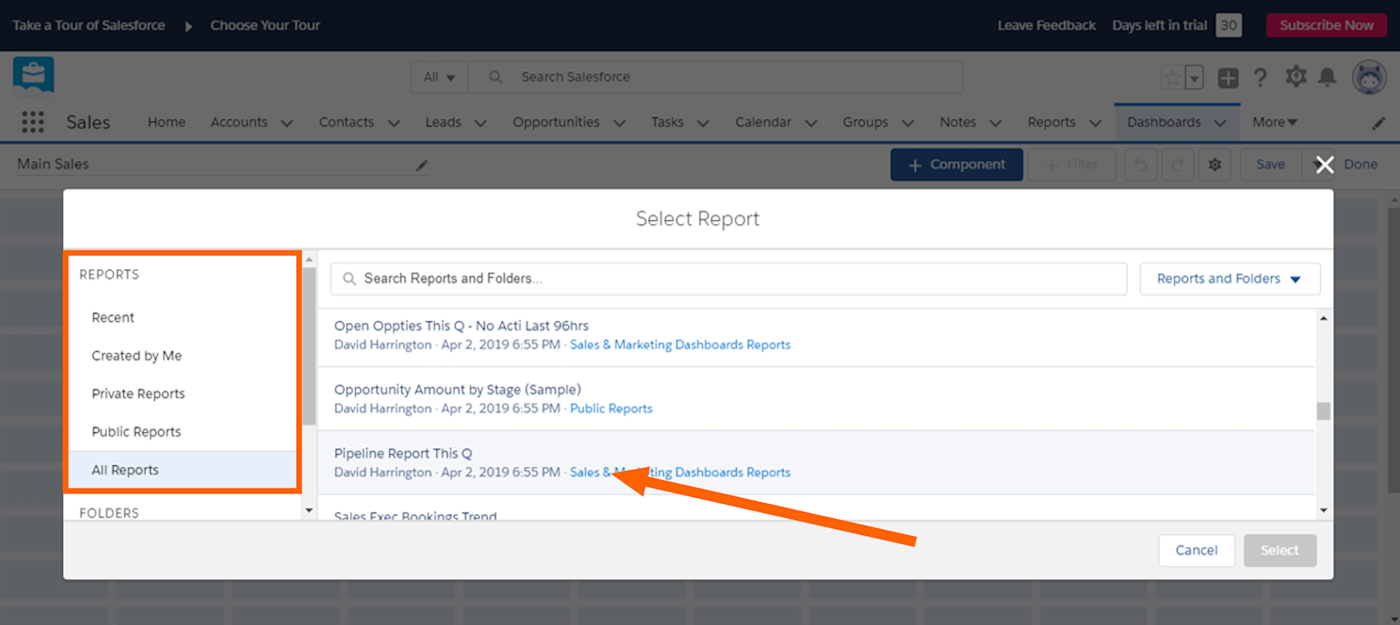
Keep in mind that each dashboard component you add relates to one source report. A sales manager, for example, might want to add a dashboard component visualizing their current sales pipeline by stage.
Note: If certain reports are restricted to specific users or roles, unauthorized users won't be able to create a dashboard based on those reports.
To add a component, click Add Component on the dashboard canvas screen. You'll then be taken to a screen where you can select the specific report you'd like the component to reflect. In this case, we'll select the built-in report for pipeline by current quarter.
Next, you'll select the graphic visualization you'd like to see for the dashboard component. You'll want to experiment with what works best for the specific report you're pulling from. For sales pipeline, the funnel graphic is popular, so we'll go ahead and select that option.
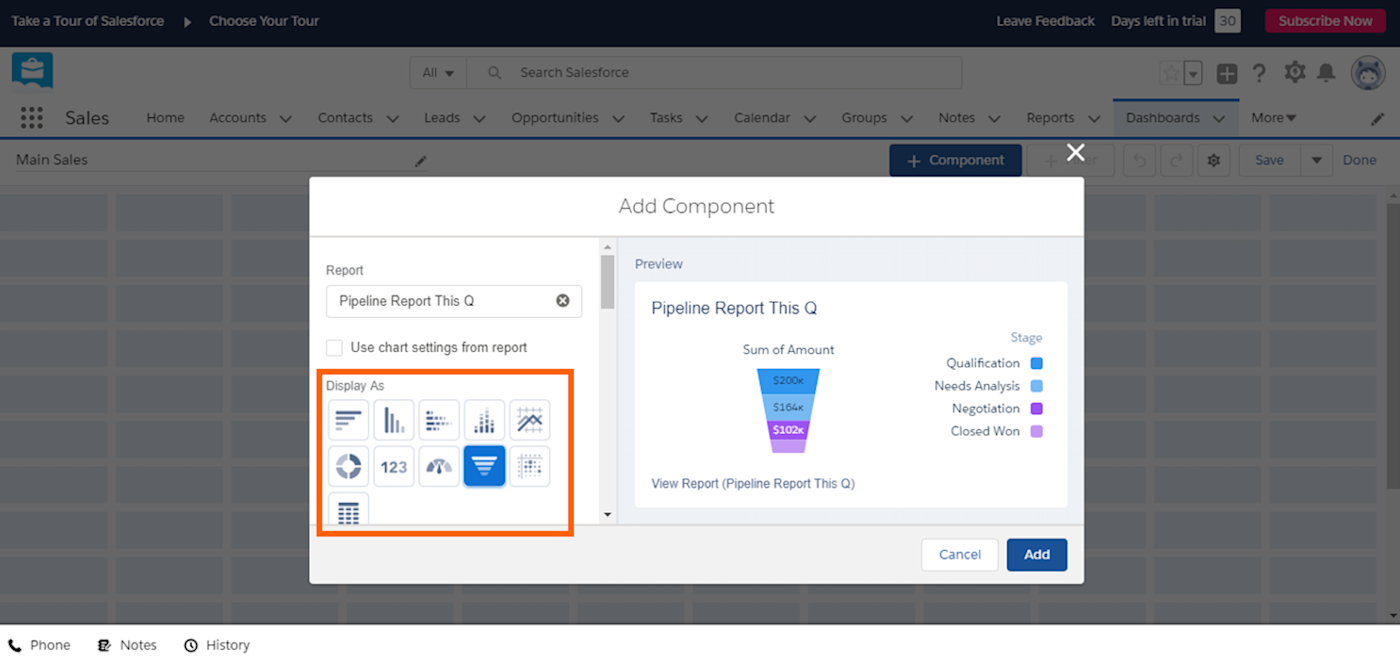
After you click Add, the component will be added to your dashboard. You can then continue to add other components, remove the ones you don't want, edit the filtering logic of each component, and rearrange them visually in a drag-and-drop fashion.
When you navigate back to Dashboards and click the dashboard you've just created, you'll be able to view all of the components at once, in real-time, side-by-side (as pictured at the beginning of this section). You can also subscribe to dashboards by going to the Dashboards main tab and selecting Subscribe on the dashboard you'd like to keep tabs on. (The same goes for reports.)
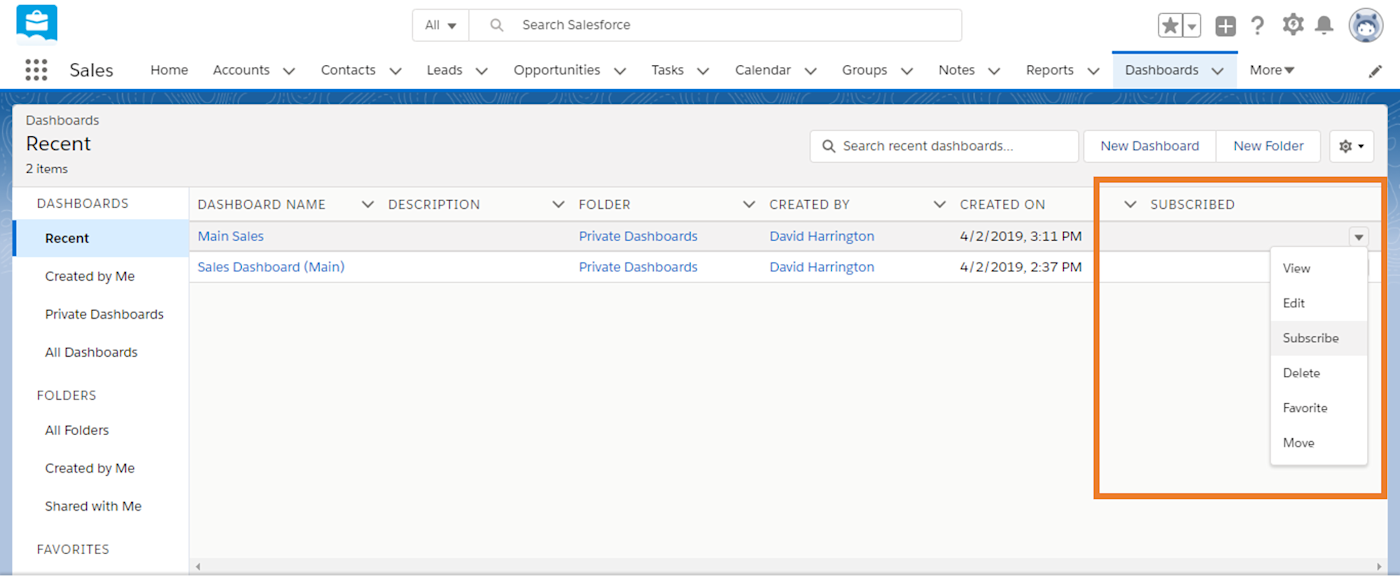
You can then select how often you'd like the dashboard components to refresh, at which point subscribers will automatically get an email with the results. This can be especially useful for sales teams, who need regular visibility into key metrics so they know where they stand in comparison to their required benchmarks.
Reports and dashboards in Salesforce work hand-in-hand to give businesses insight into key data that will help them improve performance, decision-making, and customer intelligence. The more time you spend creating custom reports and turning them into dashboard items, the more value you'll get from this powerful Salesforce feature.
Automate Salesforce with Zapier's Salesforce integrations .
Get productivity tips delivered straight to your inbox
We'll email you 1/wk, and never share your information.
How To Create Reports And Dashboards In Salesforce
Source: https://zapier.com/blog/salesforce-reports-dashboards/
Posted by: martinezdiente.blogspot.com

0 Response to "How To Create Reports And Dashboards In Salesforce"
Post a Comment